When it comes to identifying the root causes of a problem and finding ways to address them effectively, the Ishikawa chart is a powerful tool that can make all the difference. Also known as the fishbone diagram or cause-and-effect diagram, the Ishikawa chart is a visual representation that helps teams analyze the potential causes of a specific issue or challenge.
Developed by Kaoru Ishikawa in the 1960s, this tool has since become a staple in quality management and continuous improvement processes across industries worldwide.
What is an Ishikawa Chart?
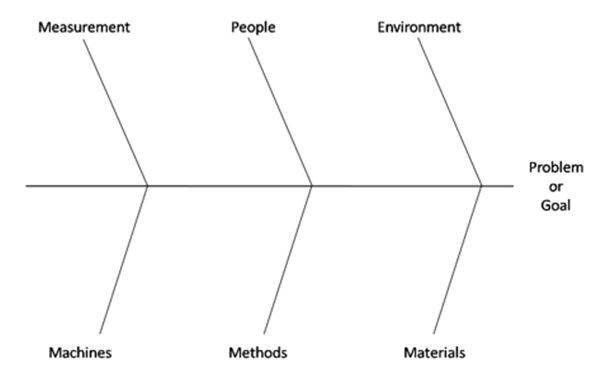
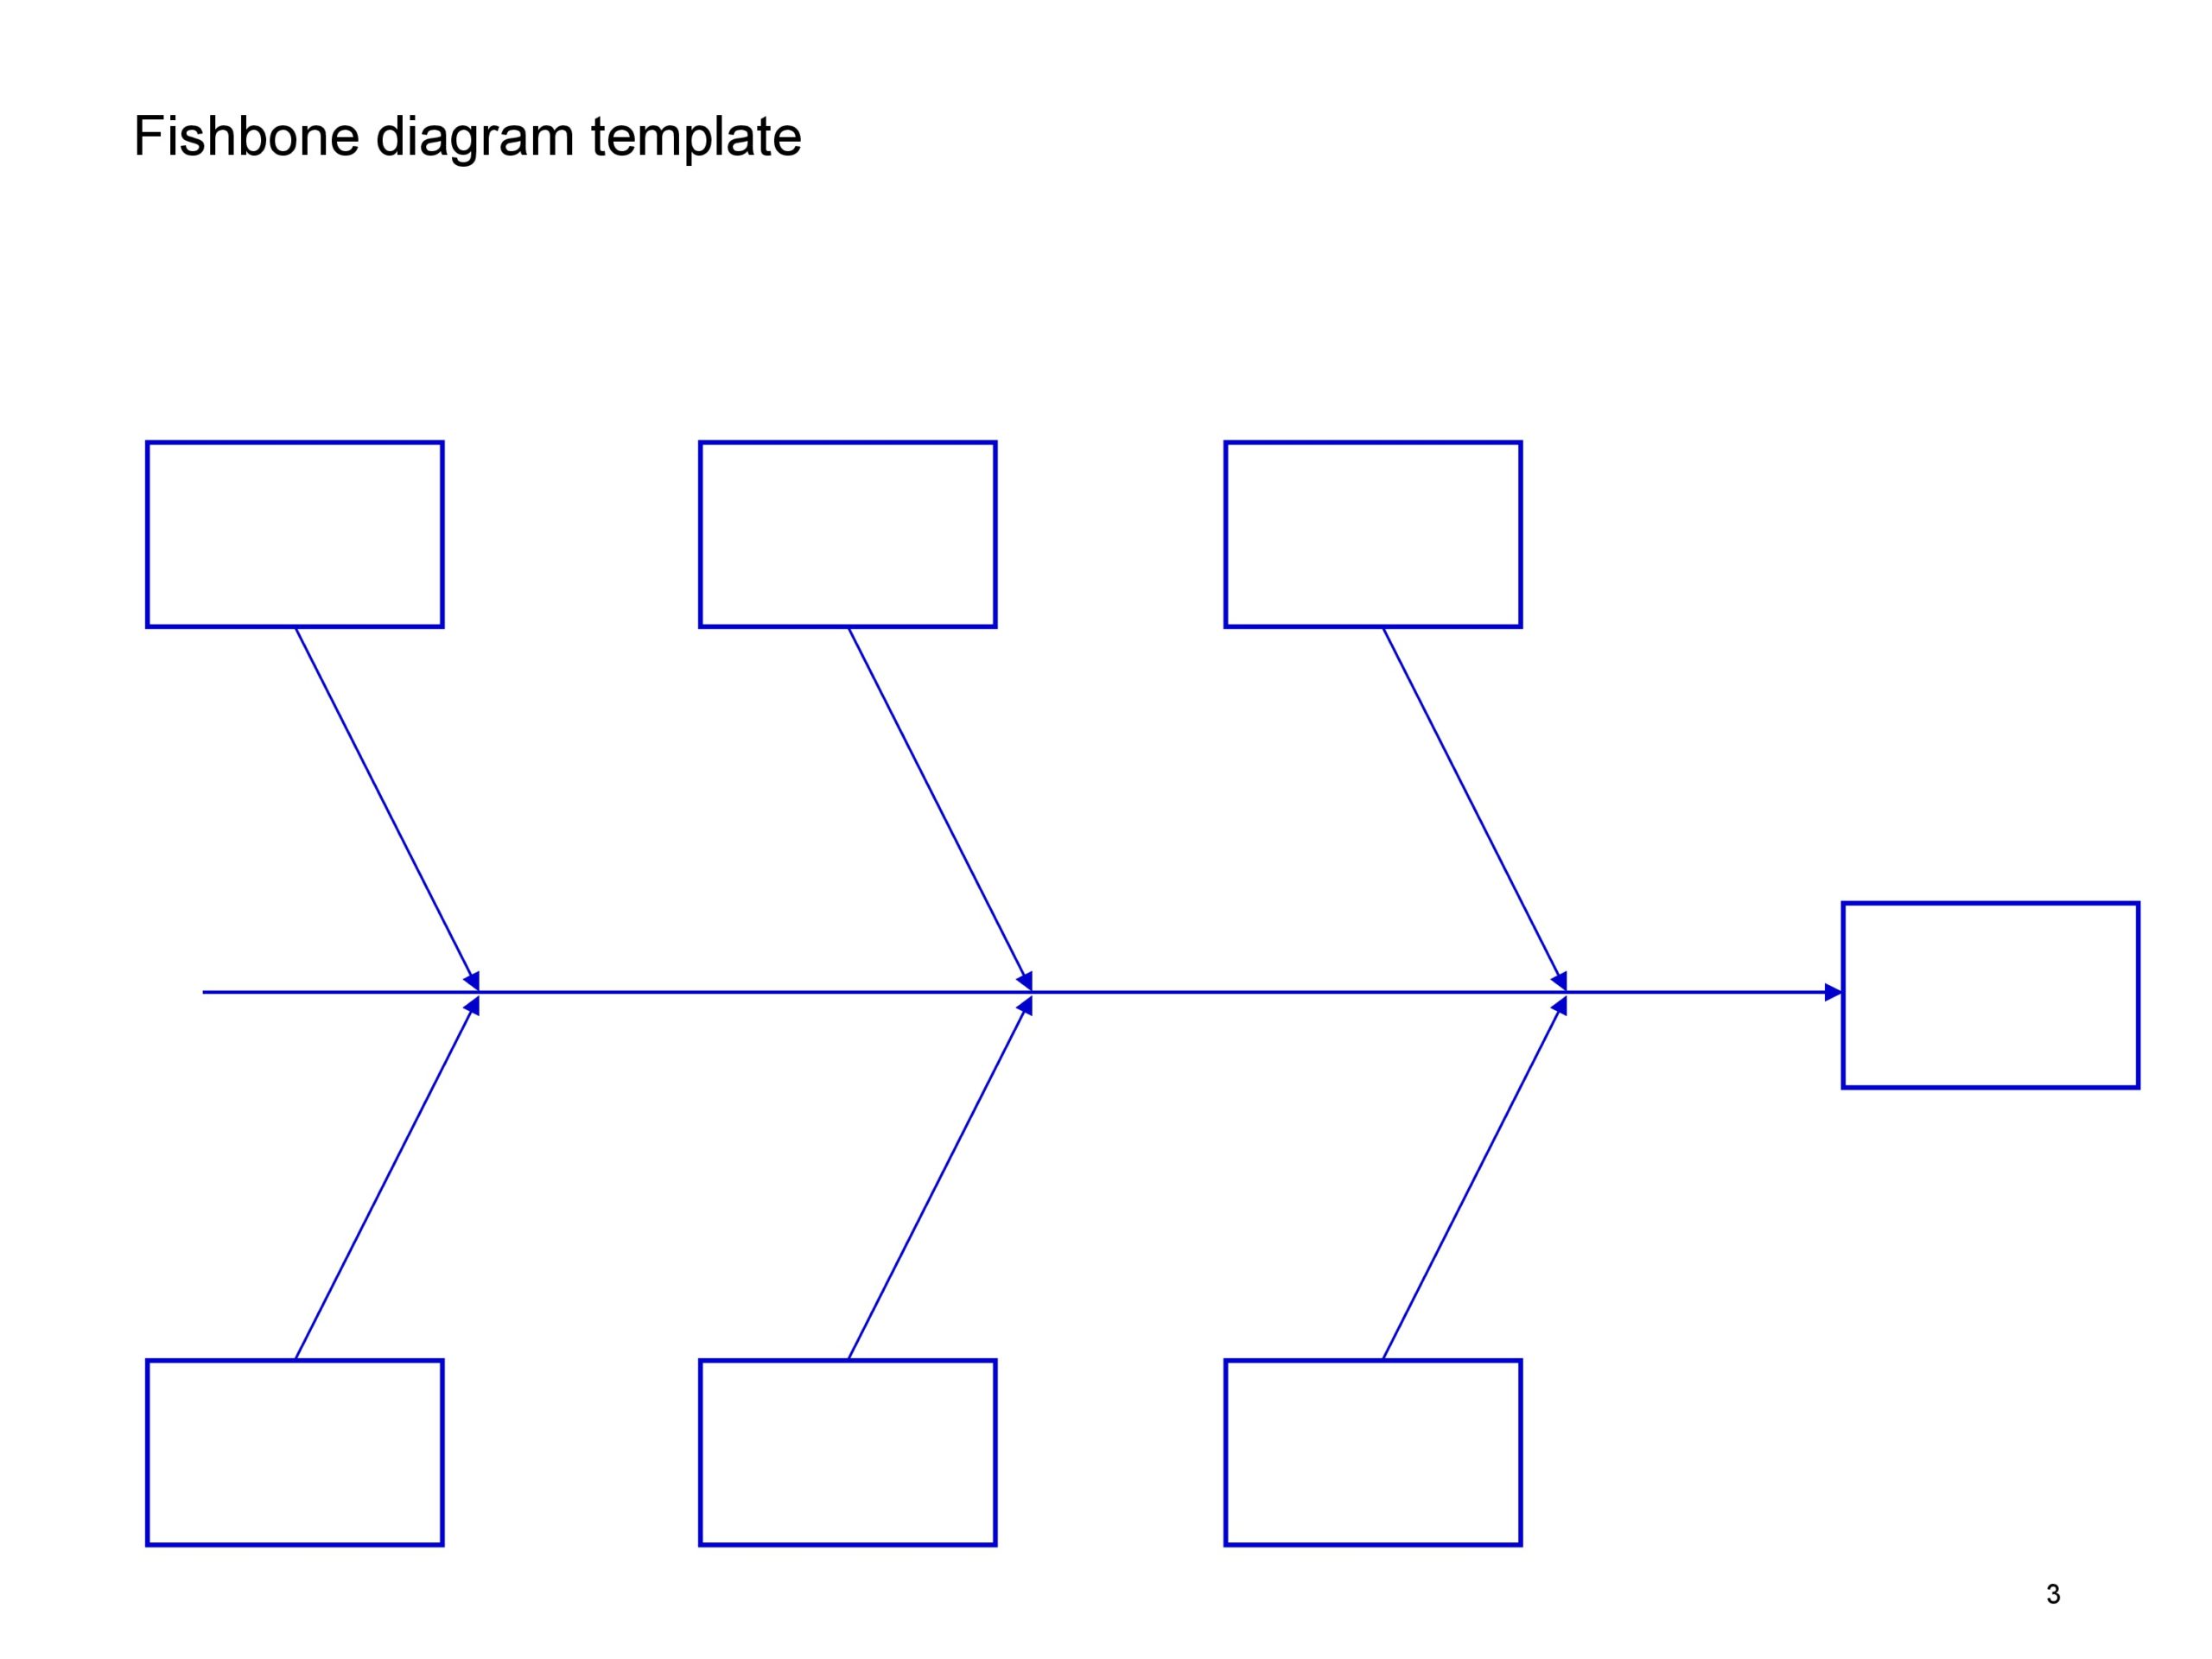
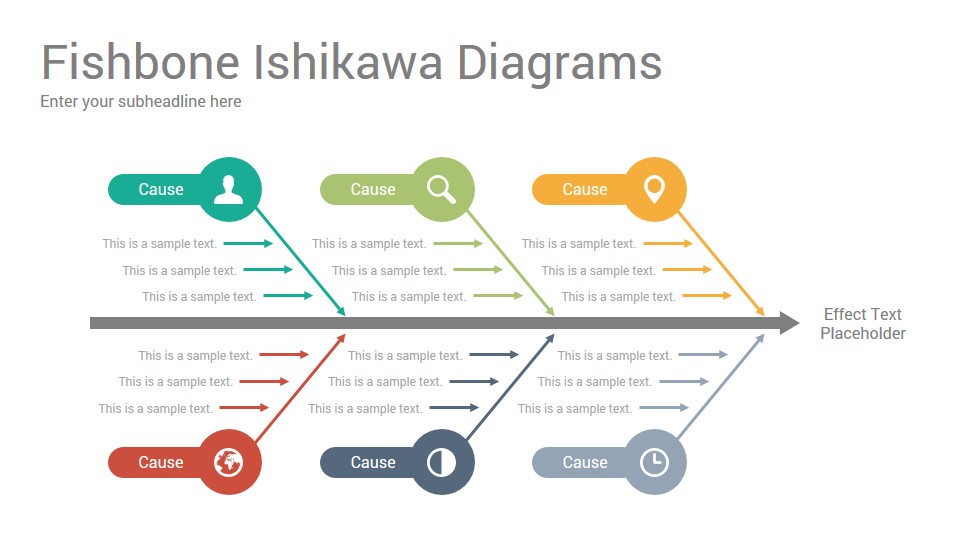
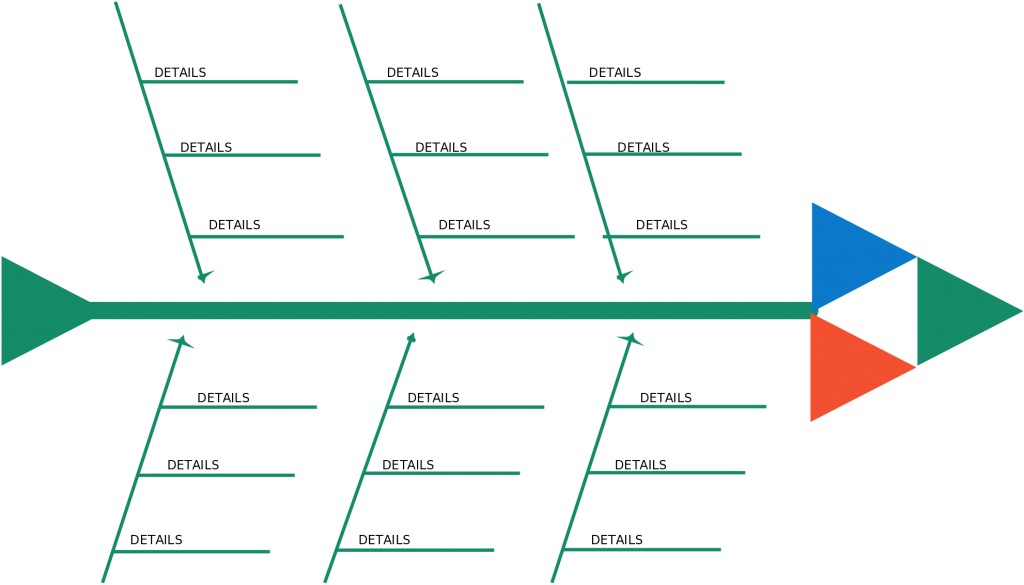
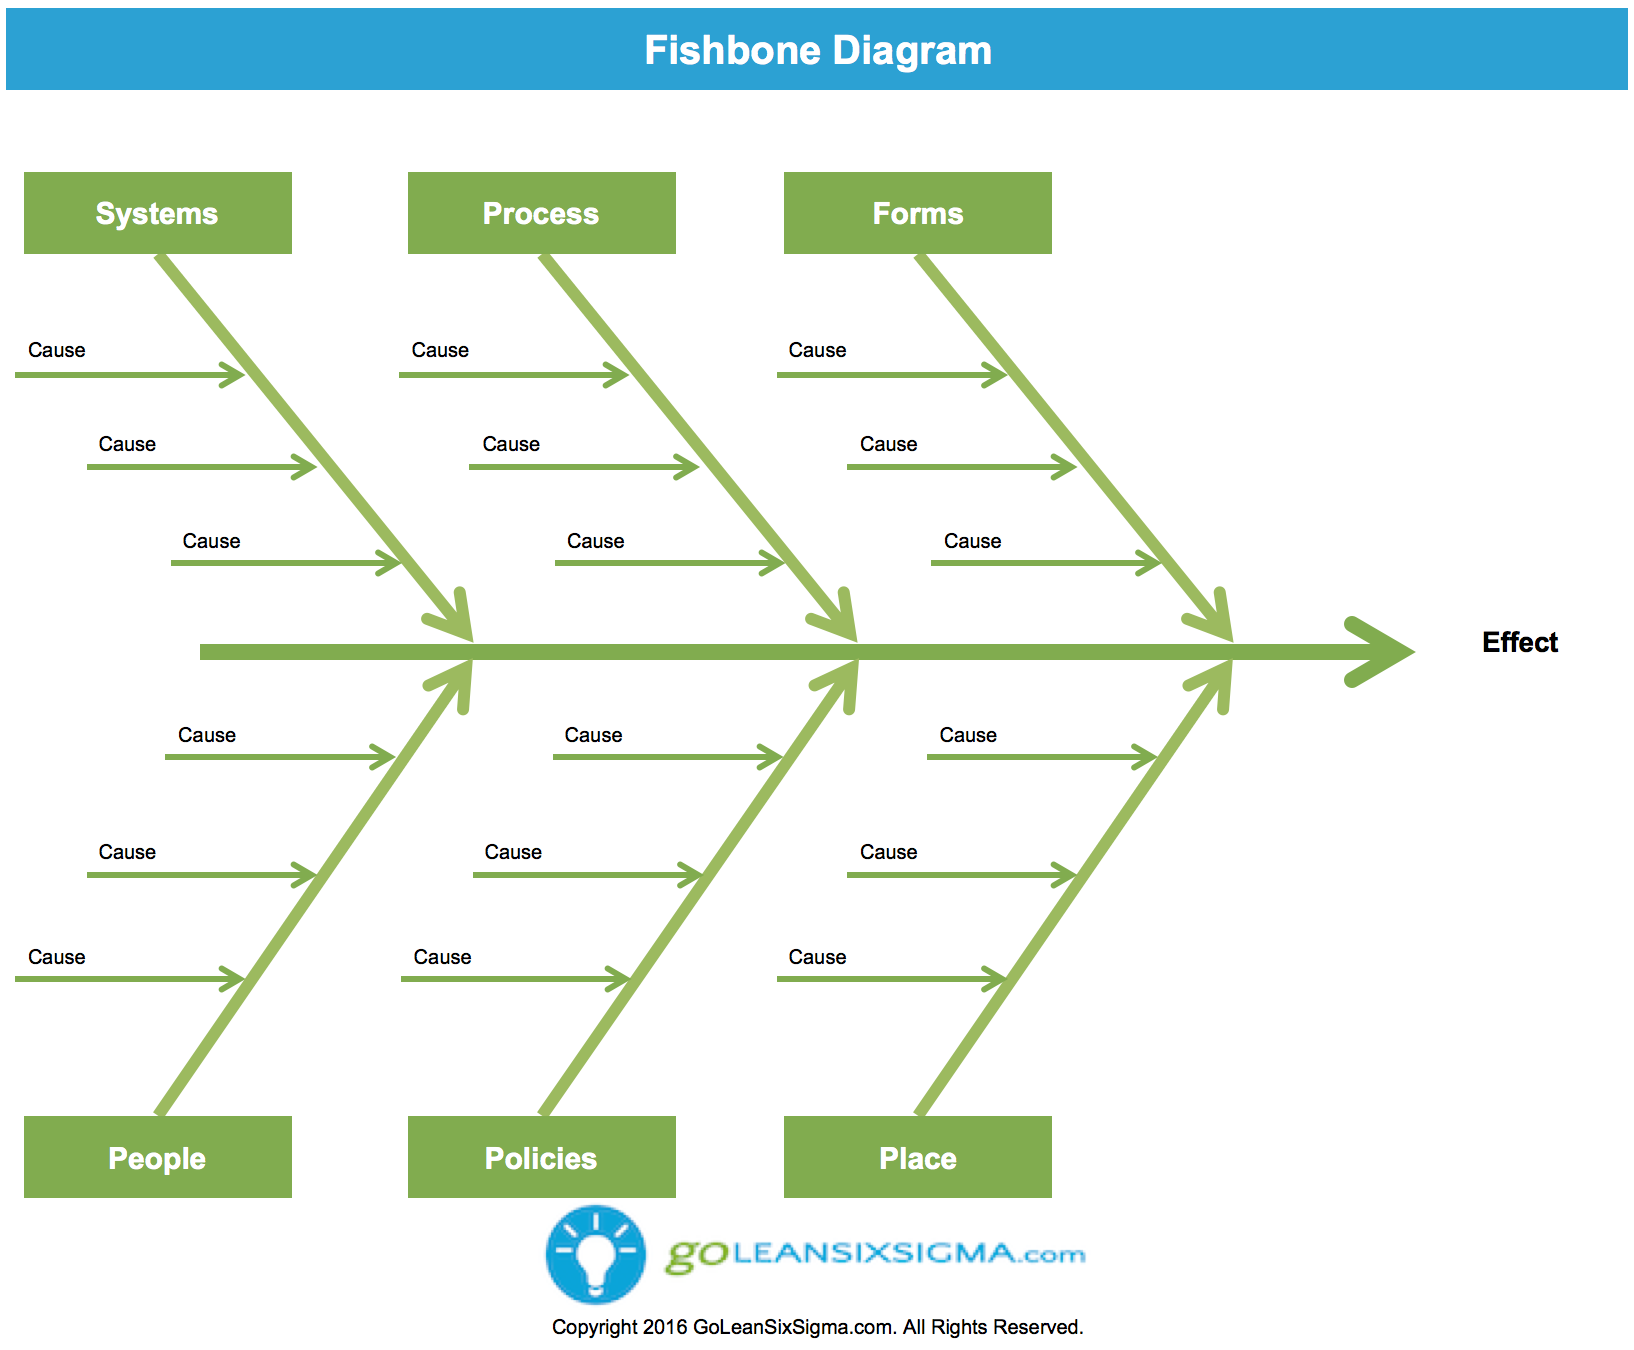
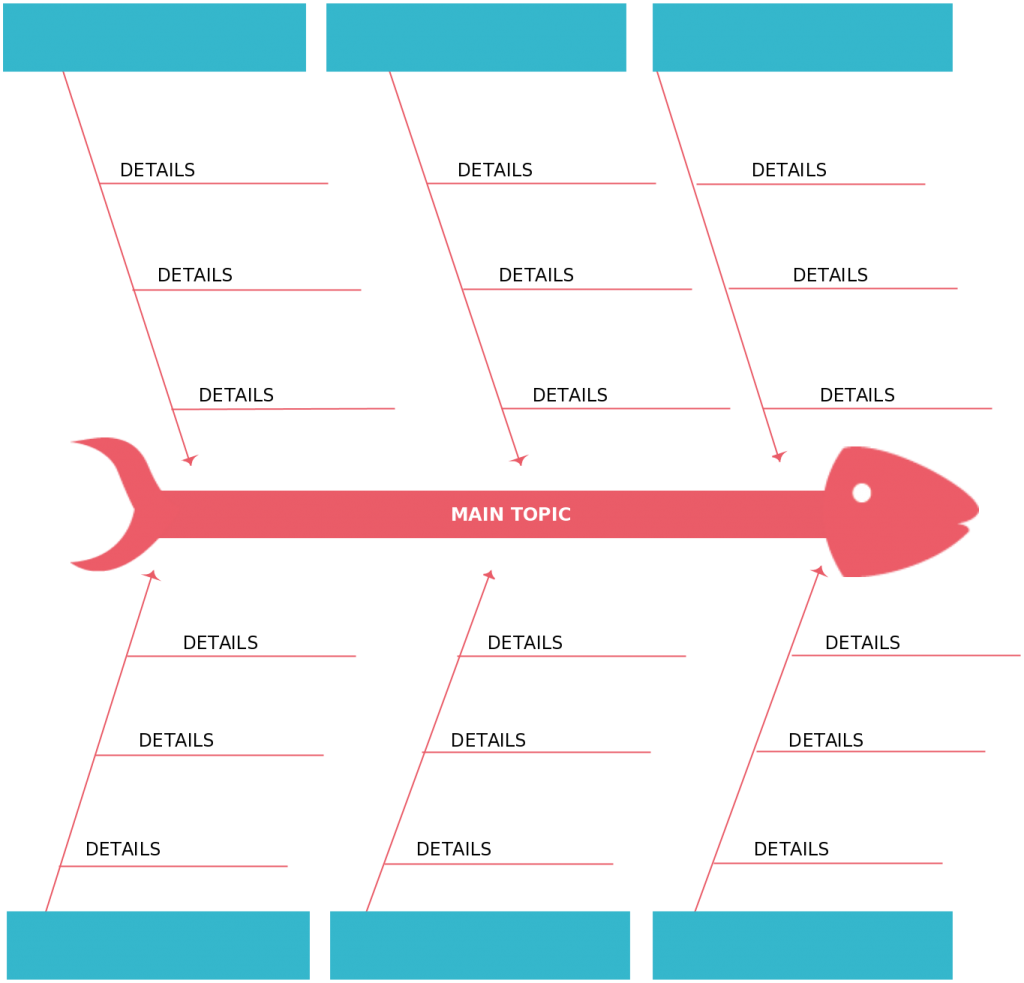
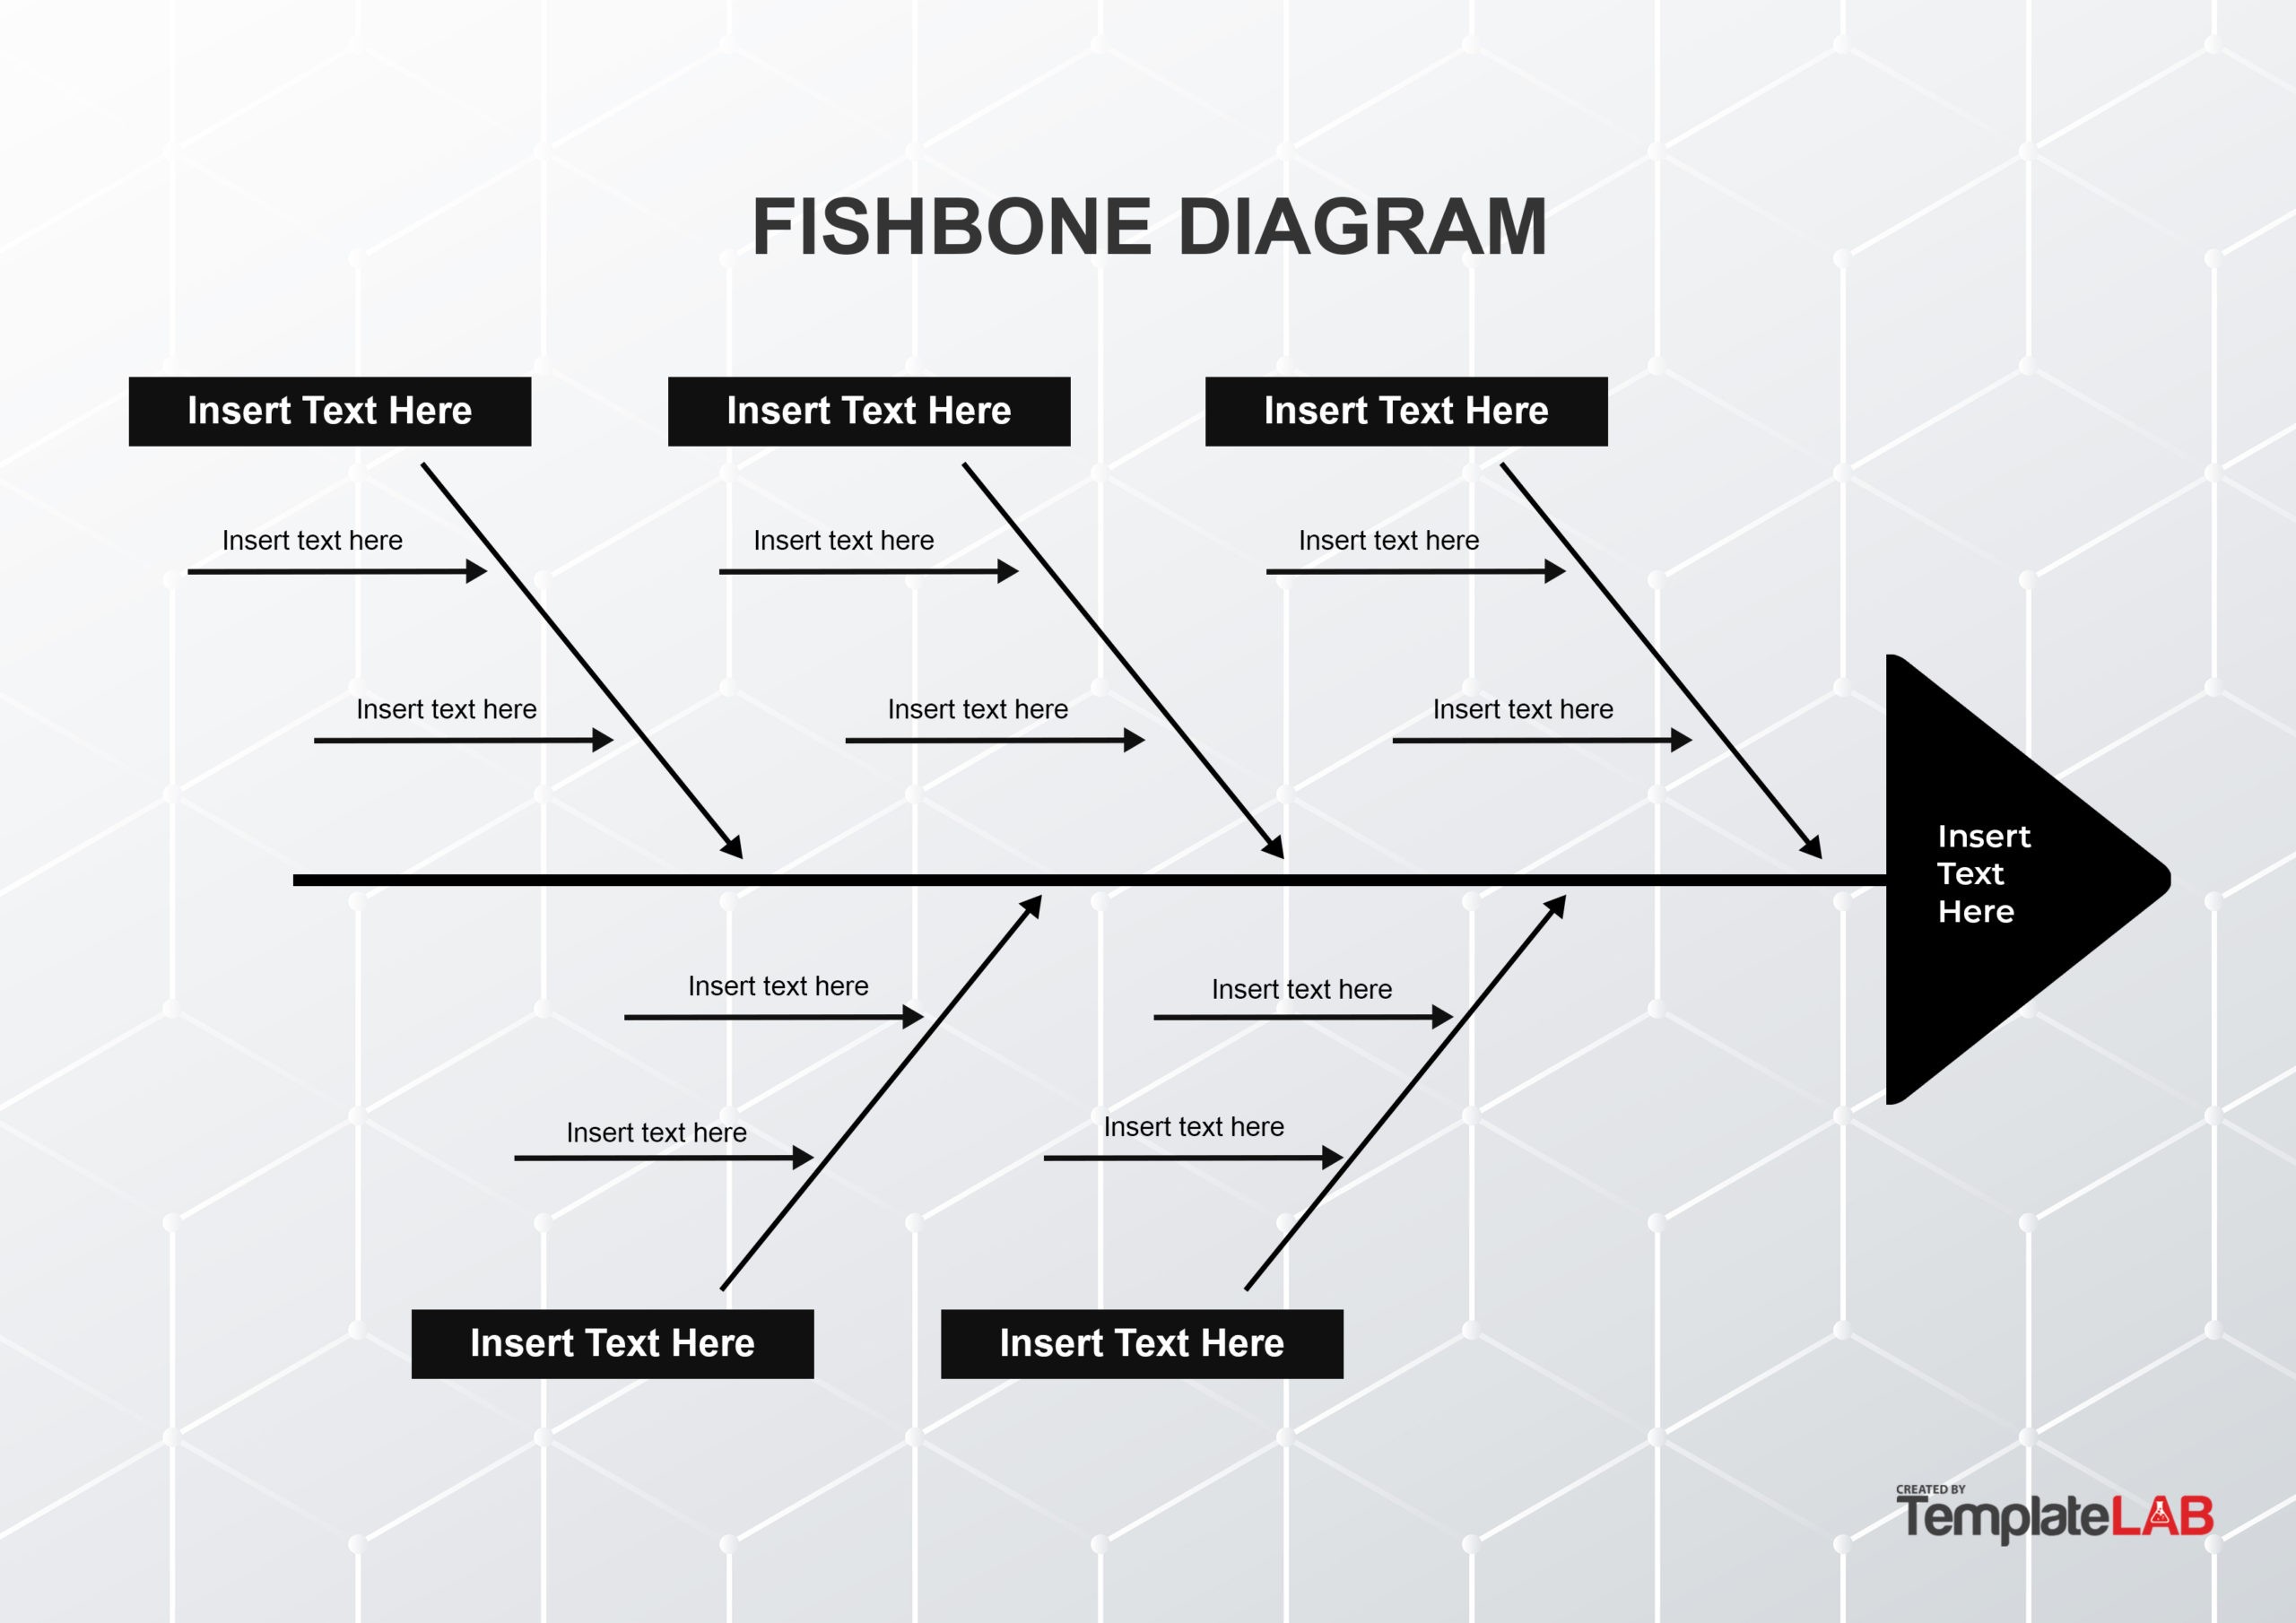
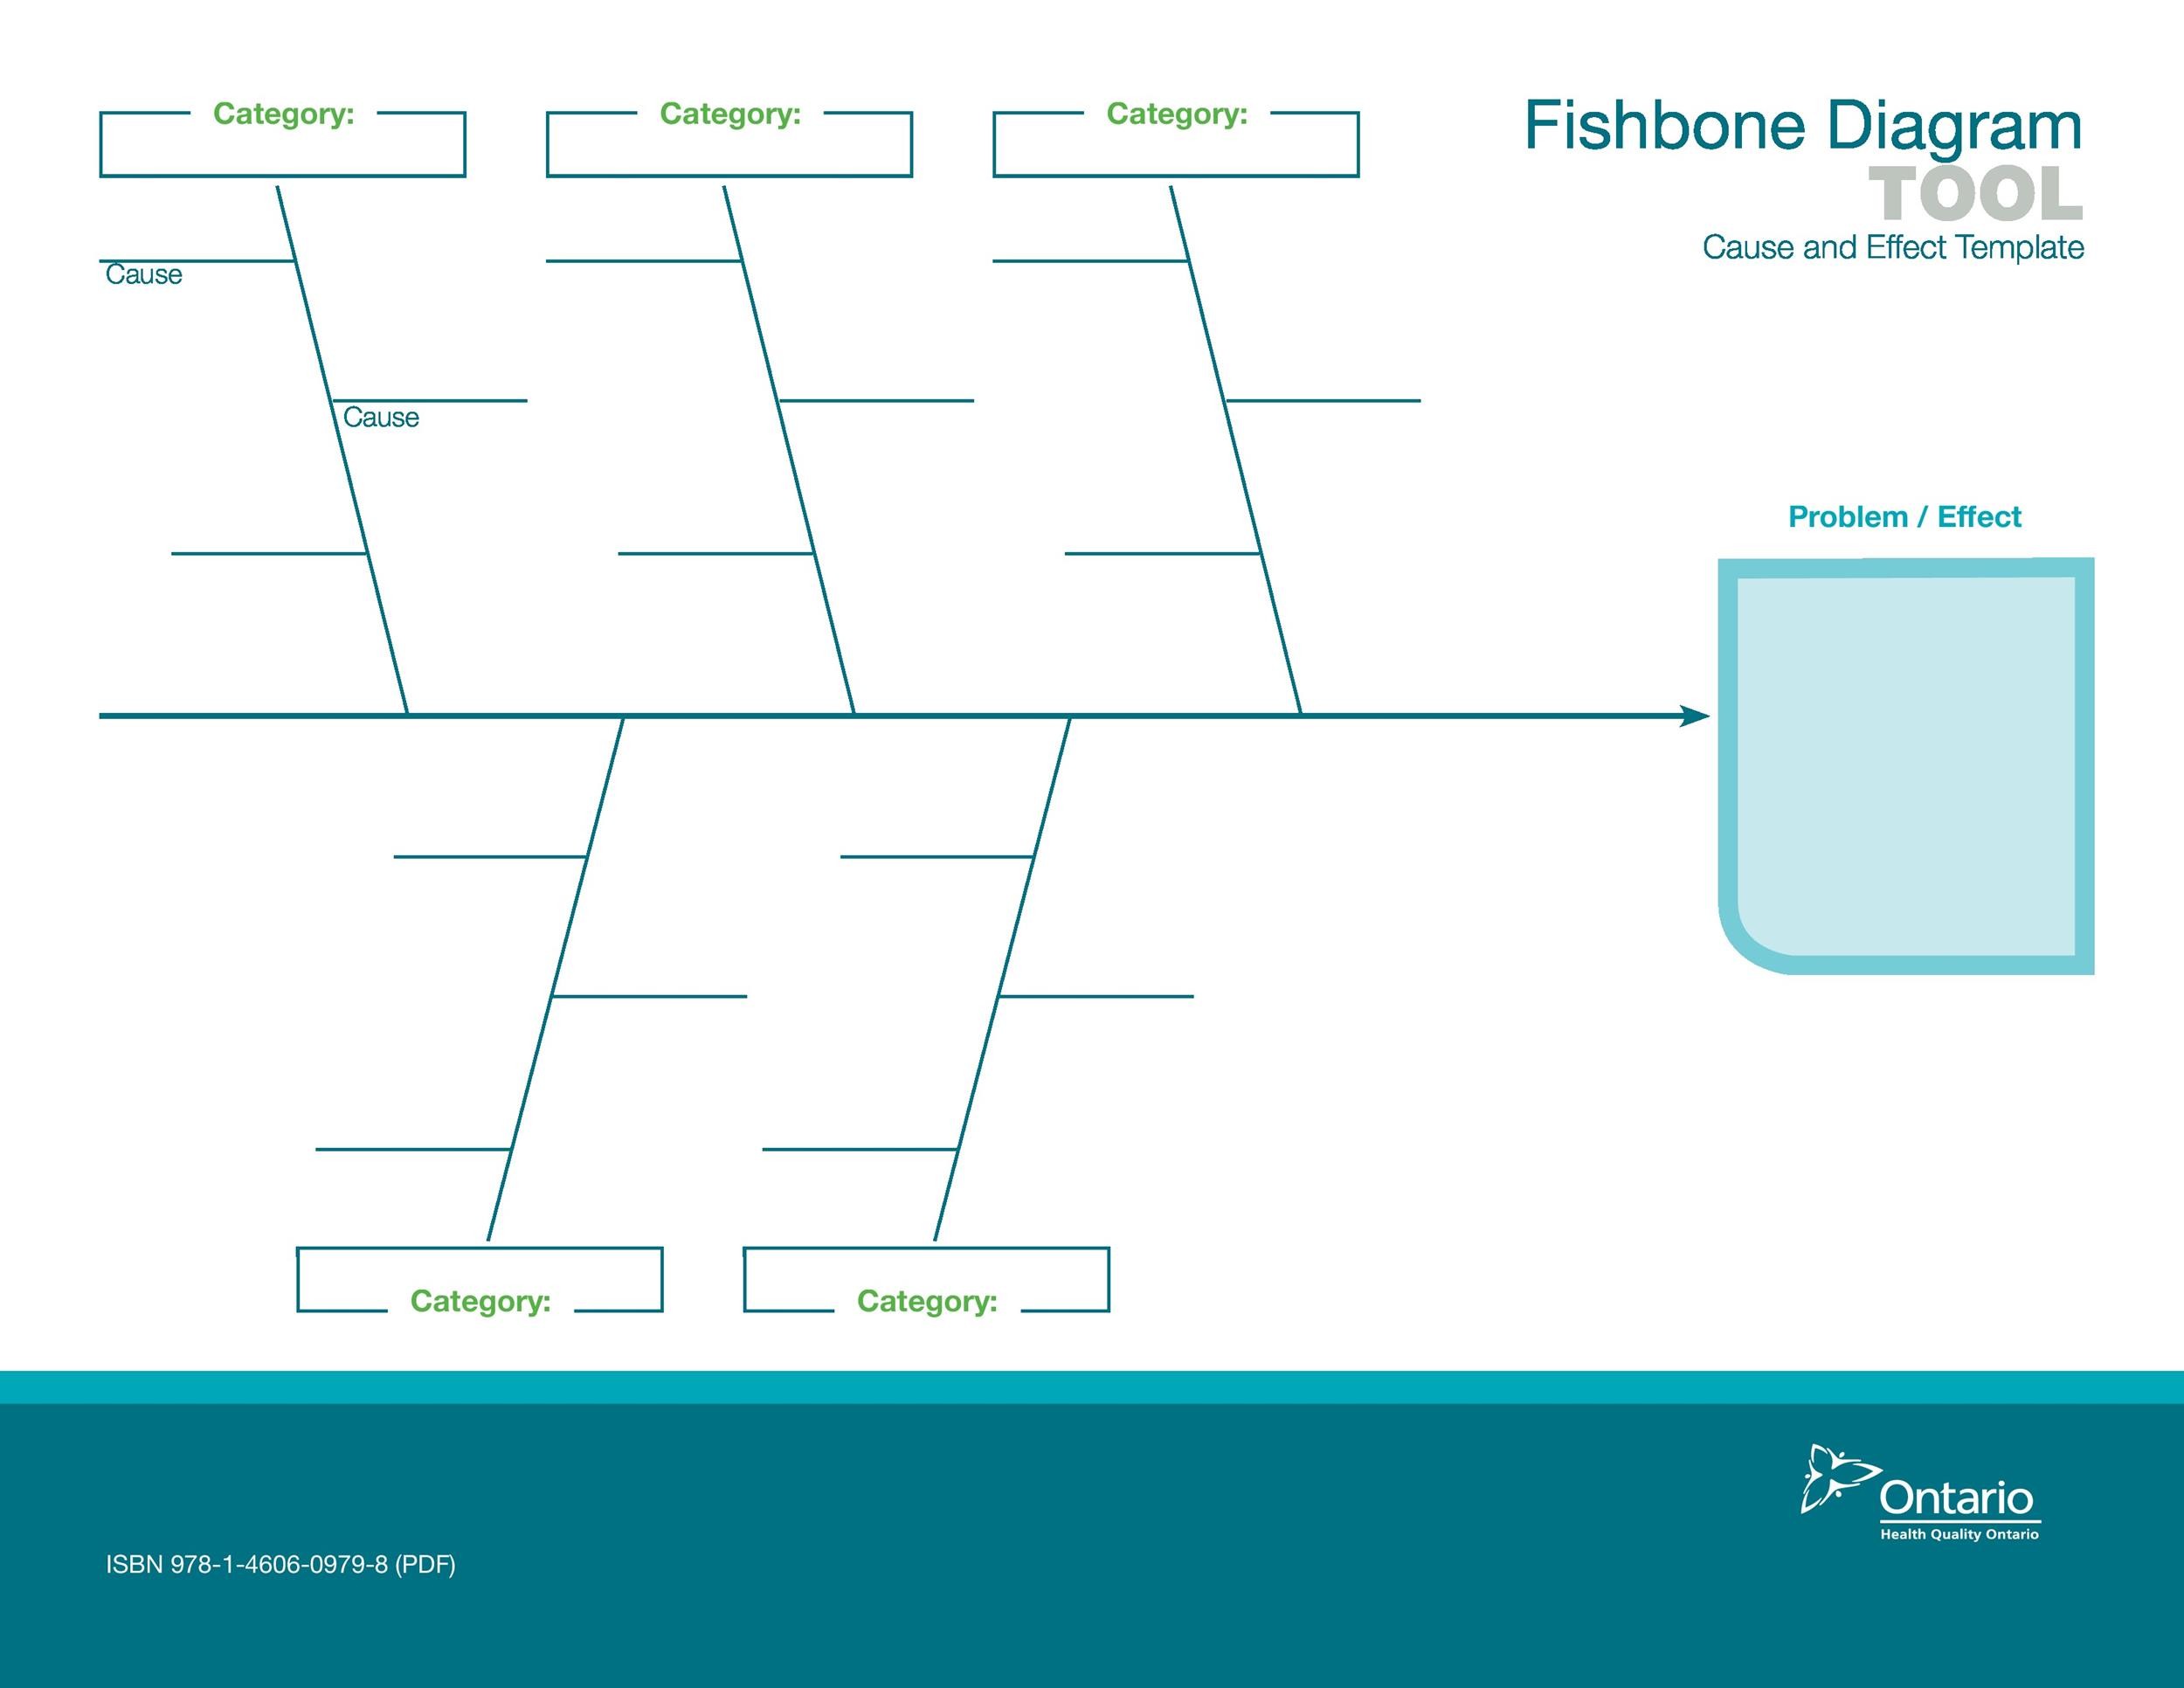
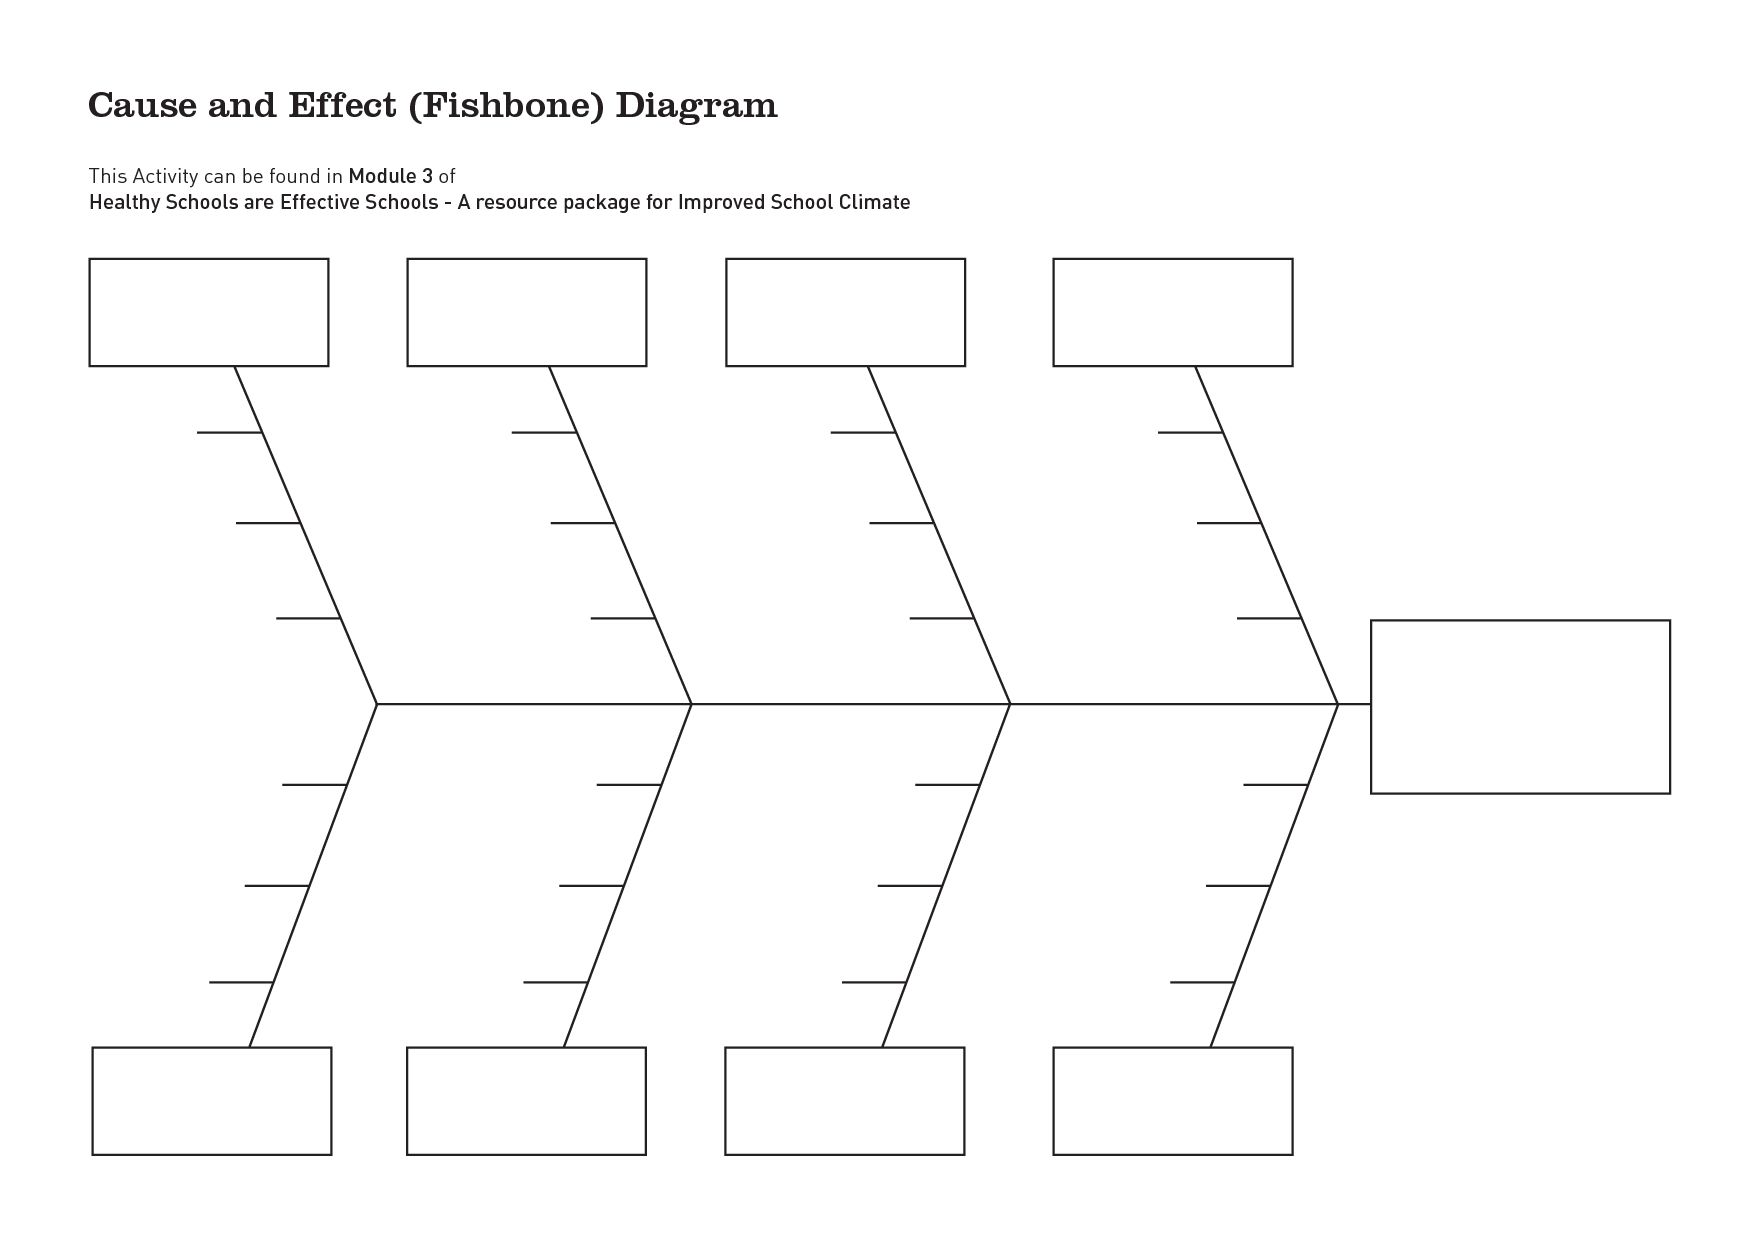
An Ishikawa chart is a diagram that illustrates the various potential causes of a specific problem or outcome. The chart takes its name from its creator, Kaoru Ishikawa, a renowned Japanese quality control expert. The structure of the Ishikawa chart resembles a fishbone, with the main problem or effect at the head of the “fish” and the potential causes branching off as the “bones.” By visually organizing and categorizing the possible causes, teams can better understand the complex relationships between different factors that may contribute to the issue at hand.
Why Use an Ishikawa Chart?
The Ishikawa chart offers several benefits that make it a valuable tool for problem-solving and decision-making processes. By using this visual representation, teams can:
- Identify root causes: The Ishikawa chart helps teams delve deep into the underlying factors contributing to a problem, rather than just addressing superficial symptoms.
- Promote collaboration: Collaborative brainstorming sessions to fill out the Ishikawa chart can foster team engagement and generate diverse perspectives on the issue at hand.
- Facilitate analysis: The structured format of the Ishikawa chart makes it easier for teams to analyze and prioritize potential causes based on their impact and likelihood.
- Enhance decision-making: With a clear overview of all possible causes, teams can make informed decisions on how to address the root issues and implement effective solutions.
What to Include in an Ishikawa Chart?
When creating an Ishikawa chart, it’s essential to include the following key components:
- Main problem or effect: Clearly define the central issue or outcome that you are investigating.
- Categories of causes: Identify and label different categories of potential causes that could contribute to the problem, such as people, processes, materials, equipment, or environment.
- Branches for causes: Create branches extending from each category to represent specific causes or factors that may influence the problem.
- Sub-causes and details: Further break down each cause into sub-causes or contributing factors to provide a detailed analysis of the root issues.
Examples
How to Create an Ishikawa Chart?
Creating an Ishikawa chart involves several steps to ensure a comprehensive analysis of the problem at hand:
1. Define the Problem
Start by clearly defining the main problem or outcome that you want to investigate using the Ishikawa chart. Be specific and avoid vague descriptions to focus your analysis effectively.
2. Identify Categories of Causes
Determine the primary categories of potential causes that could contribute to the problem. Common categories include the 6Ms (Manpower, Method, Machine, Materials, Measurement, Mother Nature) or the 4Ps (Policies, Procedures, People, Plant).
3. Brainstorm Causes
Organize a brainstorming session with relevant team members to generate a list of possible causes within each category. Encourage open discussion and consider all perspectives to uncover hidden factors.
4. Populate the Ishikawa Chart
Fill out the Ishikawa chart by mapping the identified causes under their respective categories. Use arrows to indicate relationships between causes and sub-causes, creating a clear cause-and-effect analysis.
5. Analyze and Prioritize Causes
Review the completed Ishikawa chart to analyze the potential causes and their impact on the main problem. Prioritize the key causes based on their significance and feasibility for addressing the issue effectively.
Tips for Effective Ishikawa Chart Analysis
To make the most of your Ishikawa chart analysis, consider the following tips:
- Engage diverse perspectives: Include team members from different departments or backgrounds to ensure a comprehensive analysis of potential causes.
- Use data-driven insights: Gather relevant data and evidence to support your analysis and validate the identified causes.
- Update and revise as needed: Continuously review and update your Ishikawa chart as new information or insights emerge, ensuring its relevance and accuracy.
- Implement corrective actions: Develop action plans based on the identified causes to address the root issues and prevent recurrence of the problem.
By leveraging the power of the Ishikawa chart, teams can gain valuable insights into the root causes of problems, enabling them to make informed decisions and drive continuous improvement initiatives effectively.
Ishikawa Chart Template – Download

- Ship Chart Template - October 5, 2026
- Free Printable Table Tent Template - October 5, 2026
- Free Printable Supply List Template - October 5, 2026
