What is a Process Chart?
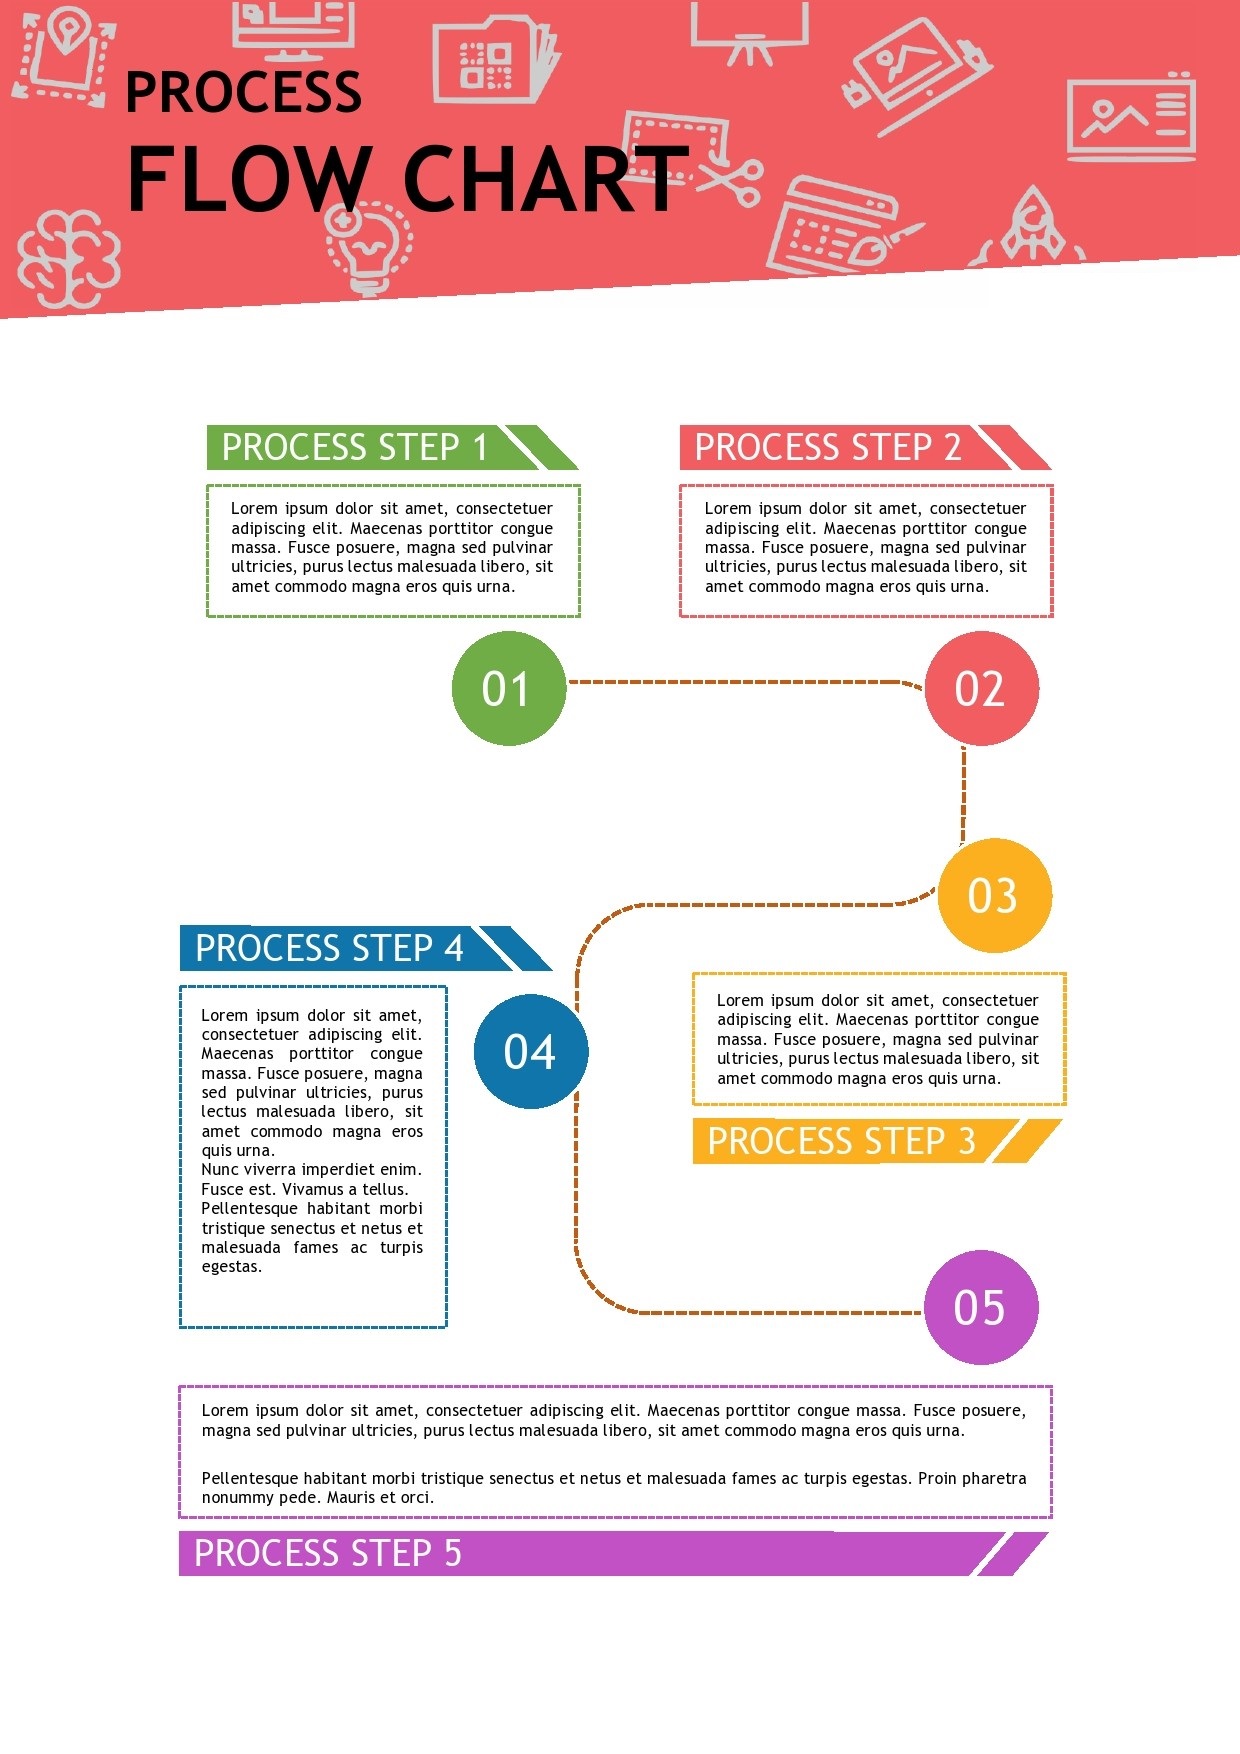
A process chart is a visual representation of the steps or activities required to achieve a specific goal. It is a powerful tool for businesses and organizations to streamline their processes, identify bottlenecks, and improve efficiency. Process charts can come in various forms, such as flowcharts, swimlane diagrams, and Gantt charts.
Why Use Process Charts?
Process charts offer several benefits for businesses looking to optimize their operations. Here are some reasons why you should consider using process charts:
- Improves Clarity: Process charts make complex processes easier to understand by breaking them down into simple steps.
- Identifies Bottlenecks: By visualizing the entire process, you can easily identify areas that are slowing down the workflow.
- Enhances Communication: Process charts help team members communicate more effectively by providing a clear visual reference.
- Increases Efficiency: By streamlining processes, businesses can save time and resources, leading to higher productivity.
- Facilitates Continuous Improvement: Process charts allow for easy monitoring and evaluation of processes, making it easier to implement changes for better results.
What to Include in a Process Chart
When creating a process chart, it is important to include the following elements to ensure clarity and effectiveness:
- Start and End Points: Clearly define where the process begins and ends.
- Steps or Activities: Break down the process into individual steps or activities that need to be completed.
- Decision Points: Highlight any decision points where the process may branch off into different paths.
- Roles and Responsibilities: Assign roles to team members responsible for each step in the process.
- Timelines: Include timelines or deadlines for each step to ensure timely completion of the process.
How to Create a Process Chart
Creating a process chart may seem daunting at first, but with the right tools and methodology, it can be a straightforward process. Here are some steps to help you create an effective process chart:
- Identify the Process: Clearly define the process you want to map out.
- Gather Information: Collect data on each step in the process.
- Choose a Format: Select the type of process chart that best suits your needs, such as a flowchart or swimlane diagram.
- Draw the Chart: Use software or tools to create the visual representation of the process, including all the necessary elements.
- Review and Refine: Review the process chart with team members and make any necessary adjustments to improve clarity and accuracy.
Tips for Successful Process Charting
Here are some tips to help you create successful process charts that drive efficiency and productivity:
- Keep It Simple: Avoid unnecessary complexity and focus on the key steps in the process.
- Use Consistent Symbols: Ensure that symbols and shapes in the process chart have consistent meanings for easy understanding.
- Involve Stakeholders: Collaborate with team members and stakeholders to gather insights and feedback for the process chart.
- Update Regularly: Process charts should be dynamic documents that are updated as processes evolve and improve over time.
- Seek Continuous Improvement: Use process charts as a tool for ongoing evaluation and optimization of processes to drive continuous improvement.

- Free Printable Wedding Schedule Template - September 15, 2026
- Free Printable Weekly Employee Timesheet Template - September 15, 2026
- Printable Sign-in Sign-out Sheet Template - September 15, 2026
