A bubble map is a simple yet powerful visual thinking tool that helps organize ideas, explore concepts, and understand relationships between different pieces of information. It places a central topic inside a large bubble and surrounds it with smaller bubbles containing related descriptions, characteristics, or supporting ideas.
Whether you are brainstorming a new project, studying a complex subject, developing creative ideas, or planning a presentation, a bubble map can make information easier to understand. Its visual structure allows you to break down a broad topic into smaller, more manageable parts without losing sight of the main idea.
In this guide, you will learn what a bubble map is, how it works, its main benefits, and how to create one step by step. You will also discover practical bubble map examples and useful tips for making your diagrams clear, organized, and effective.
What Is a Bubble Map?
A bubble map is a graphic organizer that uses connected circles or bubbles to represent a central topic and its related ideas. The main subject appears inside a large central bubble, while smaller bubbles branch outward to show characteristics, descriptions, or supporting information.
Each surrounding bubble represents an idea connected to the central subject. These connections help readers see how individual concepts relate to the bigger picture.
For example, if your central topic is renewable energy, the surrounding bubbles might include solar energy, wind energy, hydropower, environmental benefits, and common challenges. Each category can then connect to additional details when needed.
Unlike a traditional written outline, a bubble map presents information visually. This makes it particularly useful for people who prefer diagrams, visual learning, and creative brainstorming.
What Is the Purpose of a Bubble Map?
The primary purpose of a bubble map is to help people organize their thoughts and explore a topic visually. It provides a structured way to generate ideas, identify connections, and simplify information.
Here are some common purposes of using a bubble map:
- Brainstorming: Generate new ideas and explore different possibilities around a central subject.
- Concept development: Break a broad topic into smaller concepts and supporting details.
- Learning and comprehension: Make unfamiliar or complicated subjects easier to understand.
- Project planning: Organize goals, tasks, resources, and expected outcomes.
- Creative thinking: Encourage new perspectives and help identify ideas that might otherwise be overlooked.
- Information presentation: Communicate related concepts in a clear and visually organized format.
Because bubble maps are flexible, they can be adapted for educational activities, business discussions, personal projects, and many other situations.
Understanding the Structure of a Bubble Map
A well-designed bubble map usually contains several basic elements. Understanding how these elements work together will help you create a diagram that is easy to follow.
1. Central Bubble
The central bubble contains the main topic or subject you want to explore. It is usually the largest and most visually prominent circle in the diagram.
Choose a short, specific title that clearly communicates the subject. Examples include Healthy Lifestyle, Renewable Energy, Marketing Strategy, or Project Planning.
2. Main Idea Bubbles
Main idea bubbles surround the central topic. They represent the primary categories, characteristics, or important aspects related to the subject.
For a topic such as Healthy Lifestyle, the main bubbles might include Nutrition, Exercise, Sleep, and Mental Well-Being.
3. Supporting Information
Additional details can be included inside smaller connected bubbles or written near the main idea bubbles. These details explain each category and provide examples that make the diagram more informative.
For example, the Exercise bubble could connect to Walking, Cycling, Strength Training, and Stretching.
4. Connecting Lines
Lines connect the central topic to its related ideas. They make the relationships between concepts easy to recognize and help readers follow the diagram from the main subject to its supporting information.
Bubble Map Examples
Looking at practical examples is one of the easiest ways to understand how bubble maps work. Different layouts can serve different purposes, depending on the information you want to organize.
Example 1: Bubble Map for Understanding Complex Concepts
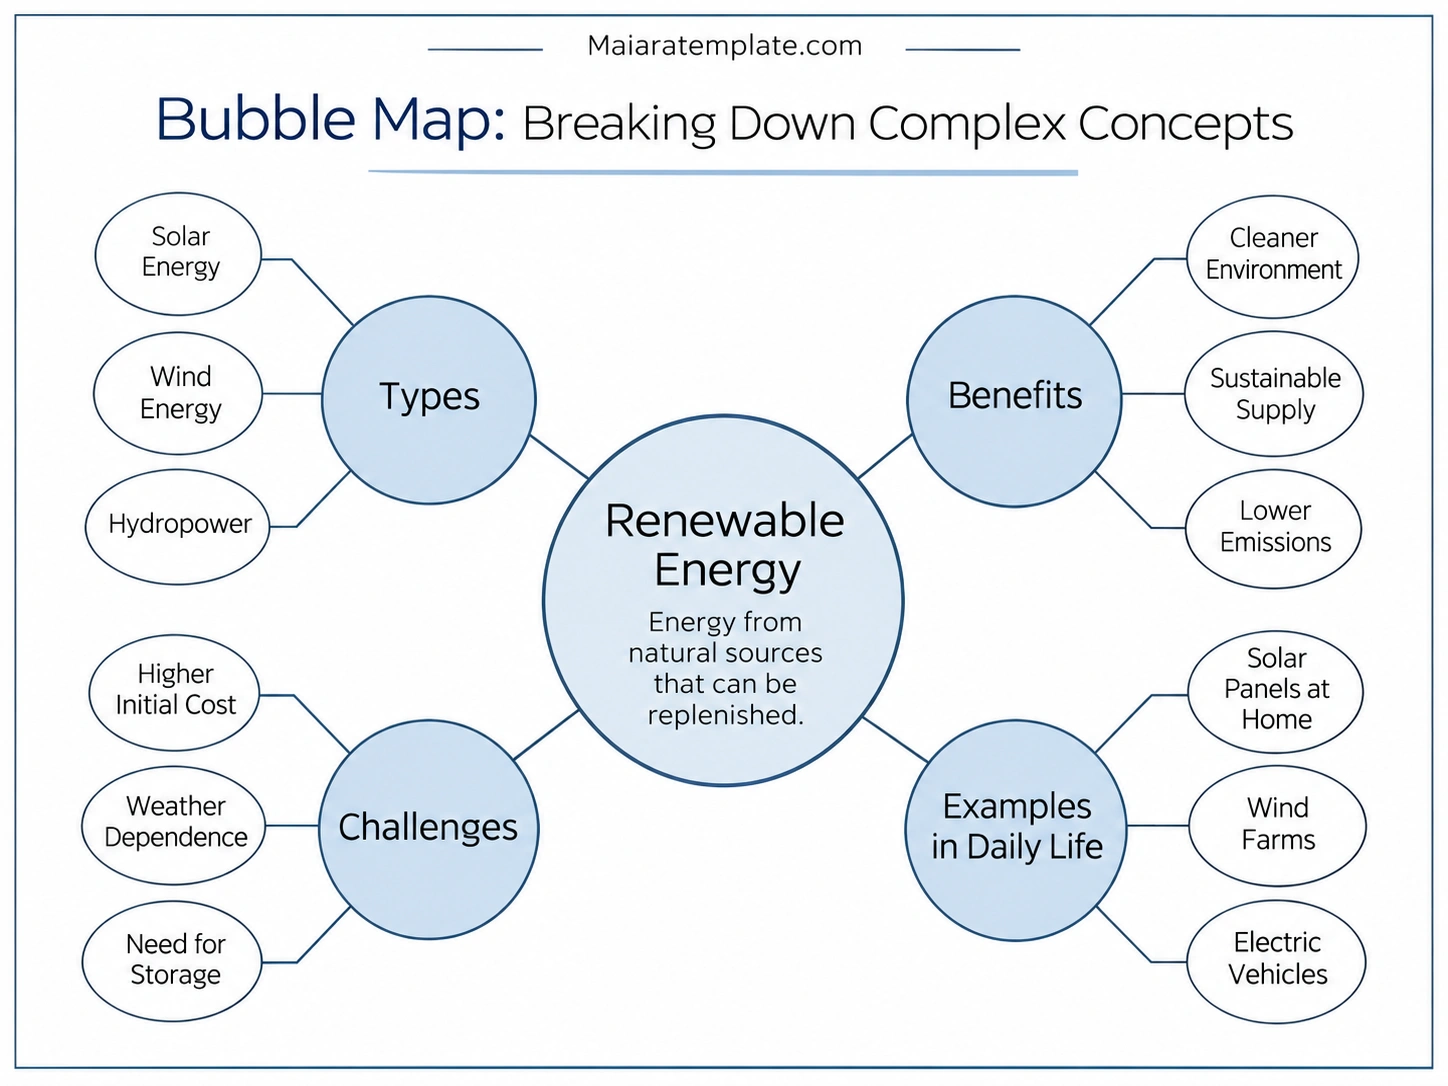
A bubble map can simplify a complicated subject by dividing it into several major categories. Consider a renewable energy bubble map with the central topic connected to four main ideas: Types, Benefits, Challenges, and Examples in Daily Life.
Each category provides a different perspective on the subject. Types might include solar energy, wind energy, and hydropower, while Benefits could include lower emissions and a cleaner environment.
This structure makes it easier to understand a broad concept without having to read lengthy explanations first.
Example 2: Bubble Map for Brainstorming Ideas
Bubble maps are also useful when you need to generate ideas for a personal activity, school assignment, or creative project.
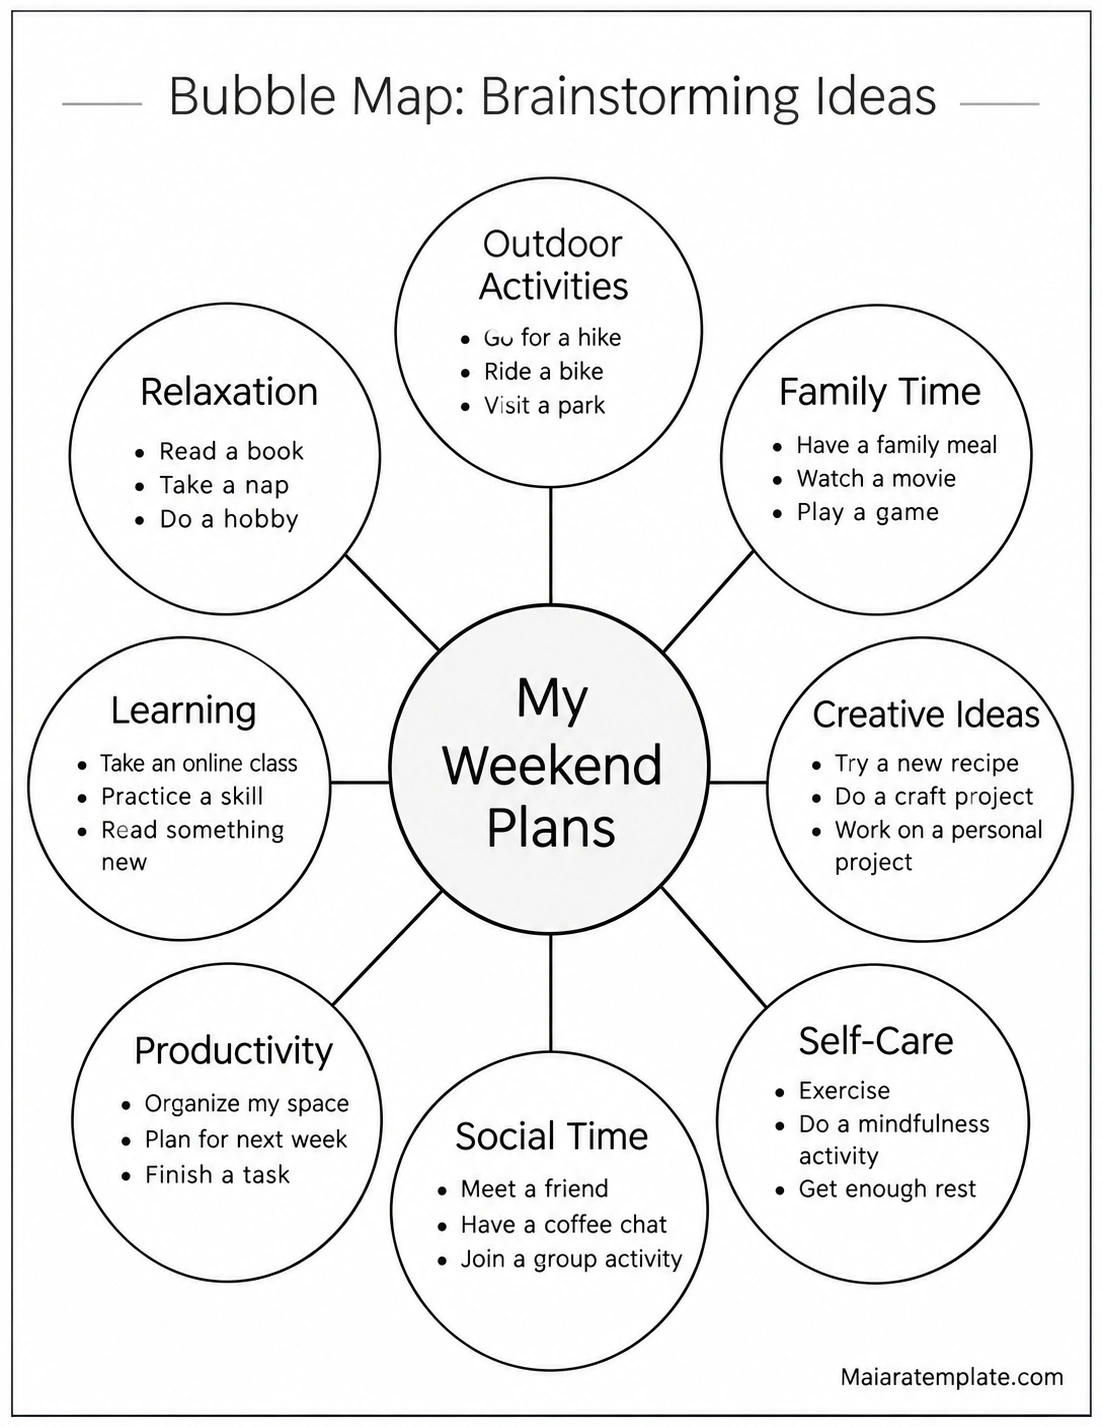
For example, a weekend planning bubble map can begin with My Weekend Plans as the central topic. Surrounding bubbles can represent Outdoor Activities, Relaxation, Family Time, Learning, Creative Ideas, Productivity, Social Time, and Self-Care.
Each category can contain smaller ideas that help you explore different possibilities. This approach encourages creative thinking while keeping your ideas organized.
Example 3: Bubble Map for Project Planning
In a professional environment, bubble maps can help organize the essential elements of a project before creating a detailed plan.
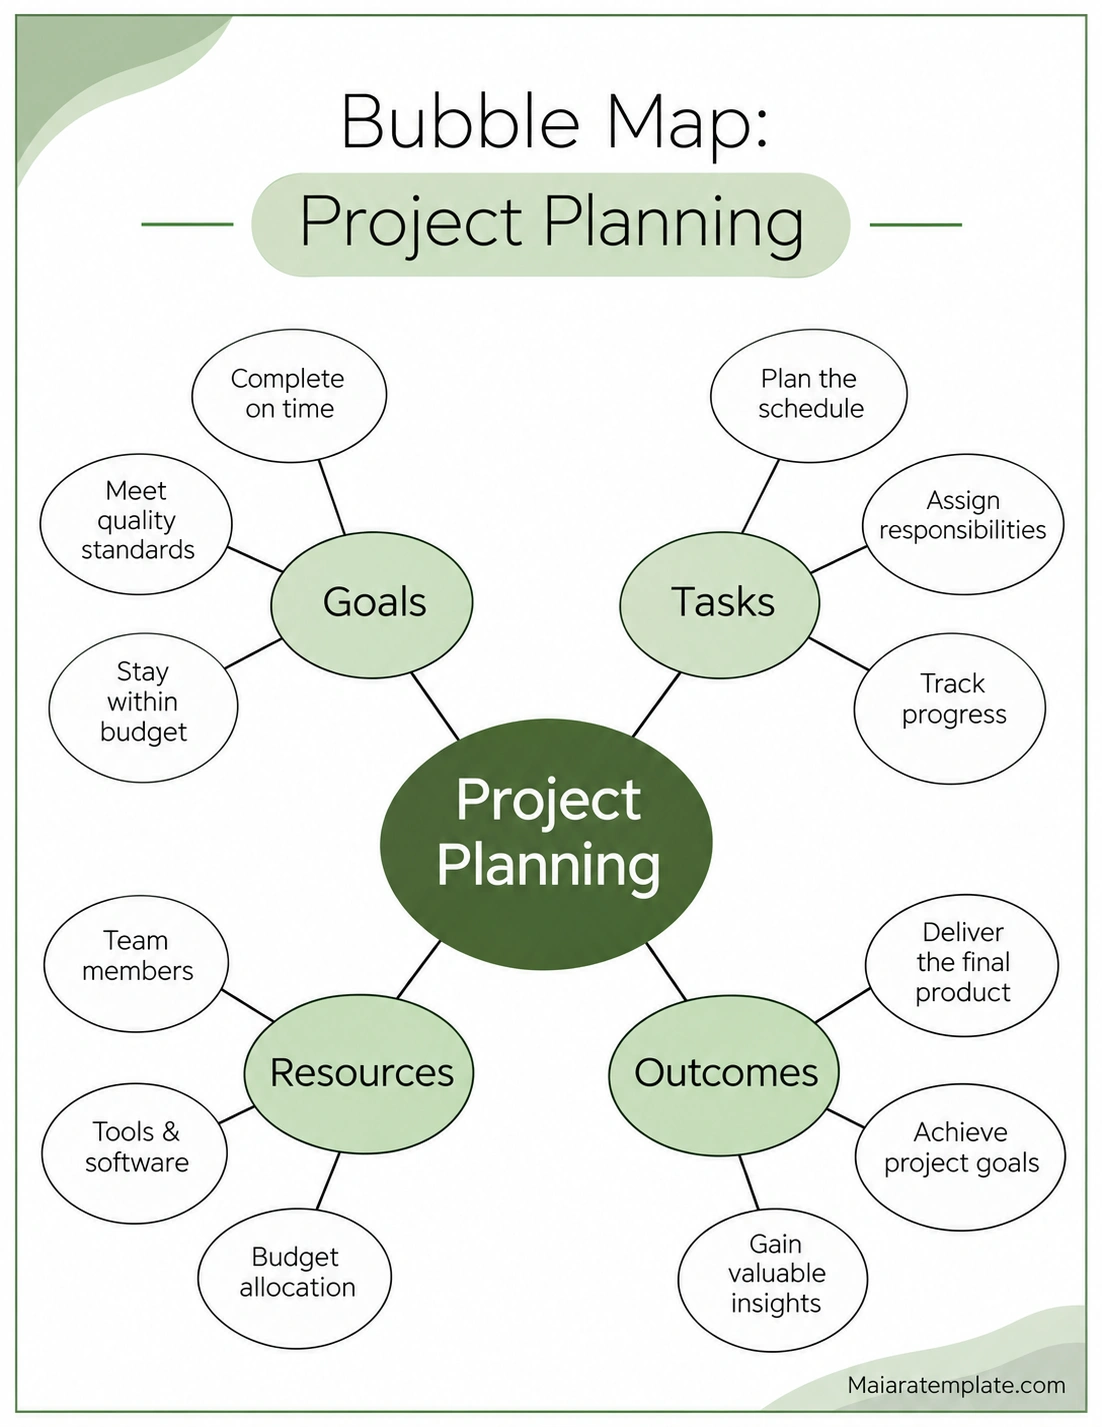
For instance, a Project Planning bubble map can have four main branches: Goals, Tasks, Resources, and Outcomes. Each branch contains specific details that explain what the project requires and what it aims to achieve.
This visual structure helps teams understand the bigger picture, identify important requirements, and discuss project priorities before moving into execution.
Benefits of Using a Bubble Map
A bubble map offers several advantages for students, teachers, professionals, and anyone who needs to organize information. Its simple design makes it accessible while providing enough flexibility for different applications.
Improves Idea Organization
One of the biggest benefits of a bubble map is its ability to organize scattered thoughts. Instead of keeping ideas in separate notes, you can bring related information together around one central subject.
Encourages Creative Thinking
The open-ended structure makes it easier to explore different possibilities. You can add new bubbles, develop existing ideas, and discover connections as your brainstorming session progresses.
Makes Complex Topics Easier to Understand
Breaking information into smaller categories can reduce the difficulty of understanding complicated subjects. Readers can focus on one branch at a time while maintaining an overview of the entire topic.
Supports Visual Learning
Some people understand information more easily when it is presented visually. Bubble maps combine short text, shapes, and connecting lines to create a visual representation of related concepts.
Helps with Planning and Decision-Making
By displaying important ideas in one place, bubble maps can help individuals and teams identify priorities, evaluate possibilities, and prepare for more detailed planning.
How to Create a Bubble Map Step by Step
Creating a bubble map does not require advanced design skills. You can make one using paper and a pen or create a digital diagram with a graphic design or diagramming application.
Step 1: Choose a Central Topic
Start by identifying the main subject you want to explore. Write it inside a large circle in the center of your page.
Make sure the topic is specific enough to guide your brainstorming process. A focused subject generally produces more relevant ideas.
Step 2: Identify the Main Related Ideas
Think about the most important categories connected to your central topic. Write each idea inside a separate bubble surrounding the main circle.
Start with a manageable number of categories. You can always expand the diagram as new ideas emerge.
Step 3: Add Supporting Details
Develop each main idea by adding descriptions, examples, or related concepts. Use smaller bubbles when you want to show additional levels of detail.
Keep the wording short and meaningful. A bubble map should make information easier to understand rather than become crowded with lengthy paragraphs.
Step 4: Connect Related Bubbles
Draw lines between the central bubble and its related categories. If your diagram contains additional levels, connect supporting ideas to the appropriate main category.
Make sure the connections accurately represent the relationships between the ideas.
Step 5: Review and Refine Your Diagram
Review the completed bubble map to check whether the information is relevant, logically organized, and easy to read.
- Remove duplicate or unrelated ideas.
- Use consistent bubble sizes for similar categories.
- Keep labels short and easy to understand.
- Make connecting lines clear and easy to follow.
- Use simple colors to distinguish important categories.
Tips for Creating an Effective Bubble Map
A good bubble map should communicate ideas clearly without overwhelming the reader. The following practical tips can help improve your diagram.
Keep the Main Topic Clear
Always make the central subject easy to identify. Use a larger bubble or a subtle contrasting color to distinguish it from the surrounding categories.
Use Short Descriptions
Avoid placing long sentences inside bubbles. Use keywords or brief phrases that communicate the main point. Additional explanations can be written separately if necessary.
Choose a Simple Color Scheme
Colors can make a bubble map more engaging and help separate different categories. However, too many colors can make the diagram difficult to follow. Choose two or three complementary colors for a clean appearance.
Maintain Balanced Spacing
Arrange the bubbles so that the diagram has enough white space. Avoid overlapping circles or crossing lines whenever possible.
Focus on Relevant Connections
Every bubble should contribute something meaningful to the central topic. Remove information that does not support the purpose of the diagram.
Bubble Map vs. Other Graphic Organizers
Bubble maps are often compared with other graphic organizers because they share a similar visual approach. However, each diagram serves a different purpose.
- Bubble map: Organizes a central topic and its related characteristics, descriptions, or ideas.
- Double bubble map: Compares two subjects by showing their similarities and differences.
- Mind map: Explores a central topic through multiple branching ideas and interconnected concepts.
- Concept map: Shows relationships between concepts using connecting lines and descriptive linking phrases.
- Flowchart: Illustrates a sequence of steps, processes, or decisions.
Choosing the right graphic organizer depends on your goal. If you want to describe one subject and organize its related ideas, a bubble map is a practical choice. If you need to compare two subjects, a double bubble map may be more suitable.
Frequently Asked Questions About Bubble Maps
1. What is a bubble map used for?
A bubble map is used to organize ideas, describe a central topic, support brainstorming, simplify complex concepts, and visually present related information. It is commonly used in education, creative projects, and business planning.
2. What should be included in a bubble map?
A basic bubble map should include a central topic, surrounding bubbles containing related ideas or characteristics, and connecting lines. You can also add smaller bubbles with supporting details or examples.
3. How many bubbles should a bubble map have?
There is no fixed number of bubbles required. A simple bubble map may contain three to five main categories, while more detailed diagrams can include additional branches. The ideal number depends on the complexity of your topic and the amount of information you need to organize.
4. What is the difference between a bubble map and a mind map?
A bubble map typically focuses on describing a central subject through related characteristics or categories. A mind map is generally more flexible and can develop into multiple levels of branching ideas and interconnected concepts.
5. Can students use bubble maps for school assignments?
Yes. Students can use bubble maps to brainstorm essay topics, organize research, understand science concepts, plan presentations, and review lessons. Teachers can also use them as classroom activities to encourage participation and visual learning.
6. Can I create a bubble map digitally?
Yes. You can create a digital bubble map using presentation software, diagramming applications, graphic design tools, or online whiteboards. These tools make it easy to move bubbles, change colors, and update information.
7. Is a bubble map the same as a concept map?
No. Although both are visual organizers, they have different structures. A bubble map emphasizes a central topic and its related descriptions or ideas, while a concept map focuses on explaining relationships between multiple concepts through labeled connections.
8. What is the best way to make a bubble map easy to read?
Use a clear central topic, short labels, consistent shapes, sufficient spacing, and simple colors. Arrange related ideas logically and avoid adding unnecessary information.
Conclusion
A bubble map is an effective visual organizer for brainstorming, learning, concept development, and project planning. By placing a central topic inside a main bubble and connecting it to smaller related ideas, you can turn scattered thoughts into a clear and organized diagram.
Whether you are a student preparing a school assignment, a teacher explaining a lesson, or a professional planning a project, bubble maps provide a simple way to explore ideas and communicate information.
Start with one central topic, add meaningful related ideas, and build your diagram step by step. With a clear structure and thoughtful organization, a bubble map can make even complicated subjects easier to explore and understand.
Download: Bubble Map Template
